
See our starting guide to using SPSS statistics software
SPSS generally runs slowly on a Mac, compared with running on Windows. It should have all the capabilities of the Windows version, though... save for one, and that’s for Mac users who need to read SPSS SPV output files without a licensed copy. There, SPSS SmartReader (or SmartViewer) has not been updated past version 24 for the Mac, though it is available for Windows and Linux users up to version 27.
Even if you can download and run SmartViewer or SmartReader 24 (there were no versions after that when we checked in March 2022), it is painfully slow even on a modern computer, such as an i7 Mini 8,1. Expect to wait ten seconds if you are foolish enough to change any preferences. Launching takes some time and once launched, you then have to manually open the file even if you opened SmartViewer by double-clicking on an output file. Try dragging it into the (running) SmartViewer.
Finding SmartReader is hard, too; it doesn't come with SPSS, and it's hard to find on the IBM web site (don't try searching, that just takes you to a page full of coding community events). It also requires you to log into IBM, creating an IBM ID if needed. Here is the current SmartReader link (you have to create an IBM account and log in). Here is a link to the place to get the current SmartReader link. (IBM has several obsolete links to it on their web site.)
Update: Instead of SmartReader, you may be able to use PSPP, which comes in at around 1/3 the size. It can open SPV files more quickly and just as accurately as SmartReader, and will do so more consistently (in that it will actually open them repeatedly rather than freezing after the first two files). It does not seem to work with most SPV files from SPSS 28, though - so this solution may need to wait for an update to PSPP, which may take a while.
Update: SmartReader has stopped working with SPSS 28 files, too. Look for an ancient copy of SPSS that’s activated by serial numbers, and open it on a Windows XP or old Mac virtual machine.
SPSS, Inc. competes with SAS for dominance in the big leagues of statistics software. Unlike SAS, SPSS makes its flagship software for Macs and Linux as well as Windows, using a core statistics engine addressed by a Java-based front end. This lets SPSS customize the front end for each platform, and makes the software somewhat more future-proof than its past practice of outsourcing ports; but it does seem to impact the speed. What's more, the open/save dialogue boxes are a nightmare of poor programming.
To reduce confusion about the many software products produced by SPSS the company, and replace it with other types of confusion, the eponynmous statistical program was renamed to PASW in the middle of Release 17. That’s only a little confusing. Well, a lot confusing, because now there are numerous PASW-branded products. Perhaps SPSS should hire more imaginative administrators... and do more customer surveys.
Behind PASW’s dropdown menus and spreadsheet views is an industrial strength statistics engine controlled by the macro and syntax languages preferred by the hard core users. PASW makes it easier to learn the underlying syntax by letting users use the menus, and paste commands into the syntax window; or users can open a journal (log) and see what commands they’ve really been running. Serious power users may also run Python and R scripts.
SPSS, Inc. was purchased by IBM, resulting in a major price increase; SPSS 18 also added new modeler, a pricey new bootstrapping option, an extra-cost Direct Marketing module, the ability to tell the program what variables are causes and results (so it can pre-populate dialogue boxes at will), and more upgrades to the syntax window. Some odd results we got in PASW 17 (SPSS 17) long after our review was written have disappeared, and the program already works with Snow Leopard, though not always especially well; bugs don't seem to be getting addressed during the brief beta periods.
The Predictive Modeler is, in essence, the old Clementine, brought up to date and renamed; it’s essentially a data mining tool. The Direct Marketing module looks surprisingly easy to use, though lots of things look easy to use but aren’t; on the other hand, it’s good to see the SPSS people tailoring their language to the needs of market researchers, who are a fairly big market.
To SPSS’ credit, the Mac version puts the menu at the top of the screen, has standard open/save dialogues with bookmarks on the left, and other user interface conventions of the Mac world. You can, if desired, revert to the Windows look and feel, in both modern and classic versions (classic doesn’t go all the way back to version 4).
For the impatient crowd, when you double-click on a syntax or data page, PASW now loads without pausing to show dialogue boxes or do corny effects. It seems snappier that way. Another annoyance, having the output window shove itself in front of syntax every time you run a command, is now an option rather than mandated; you can have the program indicate that it's run something by playing a sound (none come with the program but .wav sounds are easy to find.)
You can change the size of dialogue boxes, so that if you want to see longer variable names in, say, Recode, you can - but you can't change the size of any particular element, resulting in some serious stretching at times.
You can assign labels to values (1="Strongly Agree") and to variables (DOD1942 = "Department of Defense Document 1942 references within this file") which makes it convenient to script, but still easy to figure out the output. Long variable names can also be used though with less flexibility.
Dialogue boxes show the variable labels if they exist, falling back on the variable names themselves where there are no variable labels. Users can choose whether the output itself shows the variable names or labels (or both), and the value names or labels (or both).
SPSS / PASW 18 is very similar in many ways to SPSS / PASW 17, with some key additions to make it more usable to more people and, of course, the name change, which swaps an obsolete acronym for an incomprehensible acronym. The program seems faster during routine operations, though it is still no speed demon, and the cute “minimize-maximize” graphic effects when opening files adds to the time delays.
For the casual statistician (like me) who needs to model survey results or causal models, a very handy new feature in PASW 18 is the ability to label variables (input, target, both, none, partition, and split); the user can then have PASW automatically assign variables in the appropriate dialogue boxes. This can be a major time-saver especially since it gets around some of the user interface flaws.
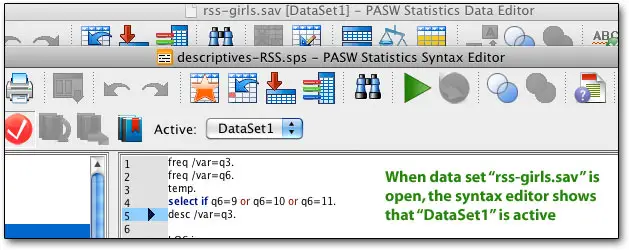
In addition, you can now have more than one dataset open at a time, a boon to merging datasets; though if it wasn’t for the gratuitous animation every time you open or close a dataset (or start the program), it wouldn’t take so long to open and close datasets. It’s nice to have multiple datasets open at once, and you can use a single syntax window to control them one at a time, as long as you remember which one you opened first:
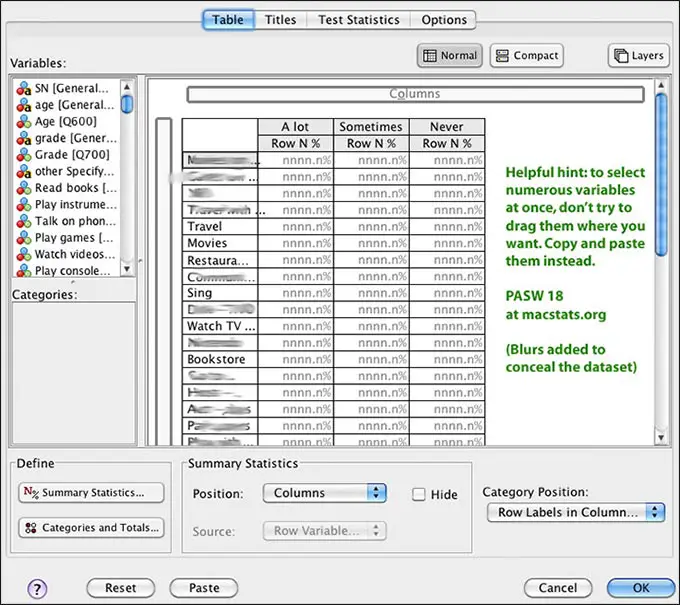
Another major upgrade is a graphic user interface for the powerful tables feature. The Tables feature has, in the past, been equally powerful and hard to use. Years ago, I spent hours poring over the manual and experimenting, finally getting the needed syntax from an SPSS employee; now, that would seem absurd, with a simple drag-and-drop interface belying an incredible amount of power and flexibility. As you change the options, a preview window shows exactly what you're doing, providing everything but data; and it does so instantly. The controls are, along with most other controls in PASW, rather clunky, with multiple buttons and dials and knobs that need twiddling to get what you want, rather than, say, one large control panel — separated by tabs, if it gets too big. The following table required clicking in the variables list, copy-pasting (after discovering that dragging doesn't work, and in fact deselects the carefully chosen variables), then adjusting four drop-downs or click-to-get-submenus. That’s for a very simple table...
The Tables feature produces the kind of tables some people have banged their head against the wall with Crystal Reports to get; it also provides extensive statistics if desired, and options such as leaving empty cells blank, putting in zeros, or putting in custom text. Unfortunately, Tables remains an expensive extra-cost option, and, again, it can take a good deal of experimenting and almost random clicking to get what you want.
As in the past, getting the output out of PASW and into some other program, like Word, is problematic. The output viewer remains roughly where it was when SPSS first started using proportional type; to modify a table you need to double-click, and the controls are insanely clunky throughout the process. Those who have time to kill will, to be fair, be able to use the new, more powerful Export to Office feature, which promises to make life easier once it’s been configured.
SPSS 18 seems less “touchy” than prior versions. The program starts up quickly; selecting a data file is easy; you can even bring in a file other than the ones allowed by your filter, by either double-clicking on it (whether it’s grayed out or not!), or by simply dragging it into the data window. That means you can drag Excel files right into SPSS — and they show up quickly and correctly. Copying and pasting output into Excel works better, though after you copy (via command-C or the menu), you do have to pause a few seconds so it “takes.”
One annoying aspect is the delay factor. Type in a command, hit Run, then wait, and then the empty table shows up just below the bottom of the output window. Eventually the data fills in, but one has to scroll the output window down to see it. On the lighter side, the tables can often be rearranged using the pivot-table feature, and after using competitors, one does appreciate the verbose output of SPSS.
Continuing from PASW 17 are the codebook procedure, which records all sorts of information about the data file; an improved syntax editor with autocompletion of common commands, code coloring, and instant reporting of errors in the syntax window; and spell checking of text strings in the data file (especially handy now that strings can be well over 256 characters — you can now use SPSS to handle qualitative survey data). An export-to-Office feature provides more control over the output, too; this feature has been greatly expanded, to the point where users will need to refer to the manual to figure out how it works. The output-export feature, though, has been made into a real power feature.
EZ RFM provides recency, frequency, and monetary analysis; and enterprise users and statistical programmers will find all sorts of new additions.
One handy feature of SPSS is a sort of variable spreadsheet, which makes it easy to find and manipulate each variable. The columns shown below can be widened or narrowed as needed; and some items (such as value labels and missing values) can be copied from one variable and pasted to others. One can also change variable types here (indeed, this is the only place for doing that easily); but it's easier to change formatting (width, decimals, and columns) from syntax. Likewise, missing values, value labels, and variable labels can all be set either way, but syntax is easier.
A new, and surprisingly handy, feature is the ability to have more than one dataset open at a time.
The “measure” column is new, and lets one declare the type of variable, which can be handy in the variable selection views (shown later). Variable names can be longer than 8 characters now but spaces and many special characters are still not allowed; fortunately variable labels are also available.
New users don't have to learn the syntax immediately; they can play around in the menus and submenus. Sometimes it’s a little awkward — poorly chosen variable labels (such as those automatically added by software saving data in SPSS format) can overfill their space, and the components of the box cannot be resized. Instead, as you move the mouse over, the full name floats over, after a substantial delay; this feature tends to get in the way more than anything else. The new use of icons is handy, though — you can quickly see which variables are appropriate in a particular analysis, if you took the time to mark them correctly. Even if you didn't, you can see the string variables easily.
For the average SPSS user, who will use a relatively small number of procedures repeatedly, the Paste button is invaluable. Instead of going to the manual immediately, the user can set all the options in this and the sub-windows, and then click on Paste. The command will then appear in the syntax window, to be re-used later, perhaps with different settings, or perhaps just with different variables. This is the easiest way to learn the syntax (though it helps to have the manual as well, to see what each setting does, and in case there are syntax commands not available through the GUI.)
As with prior versions, as you can easily slice, dice, and weight data, and pop out scatterplots using the built-in menus, SPSS automatically records your syntax into a “journal,” which you can later modify to quickly run lots of analyses very quickly.
We recommend you use the syntax guide (provided on CD, or at extra cost in book form) and type your commands as often as you can, instead of using the menus. Using SPSS becomes much, much faster that way, especially if you tend to use powerful tools such as "temp/select if" and "do if" commands for quickly selecting one or two groups. Writing little programs in the syntax mode can save a great deal of time, and separates professional programs like SPSS from software which fills the needs of more casual reseachers. (The free, open-source, and hard-to-learn R project only uses syntax for most commands.)
By typing in commands and then running them as a batch, the researcher can both take advantage of commands that don't work well as menus - such as temporary / select if - and save frequently used routines. For example, when running a linkage analysis to link employee survey data to customer or financial outcomes, I tend to run a number of regressions and correlations. It's far faster for me to type these commands in than to repeatedly trek through the menus. Likewise, if I just want to see how employees in Kansas answered a given question, I can either go through the menus, select just employees in Kansas, and select a frequency count; or I can type...
TEMP.
SELECT IF LOCATION=4.
FREQ /VAR=Q4.
Though it takes some time to learn the commands, most people tend to use the same commands over and over again. Using syntax can also save a lot of time for people who frequently use different options than the defaults. While the menus aren't too clumsy, simply typing the commands is a major timesaver.
SPSS has not changed the syntax much since version 4.0, so files written for older versions and other platforms usually work flawlessly. The data format is compatible without conversion, across versions and platforms, making it easy to share data and scripts with Windows people or users of older Macs. Data is stored in a highly compressed format, matching SPSS' mainframe heritage.
Numerous icons provide little ease-of-use features, including variable sets, a lit of variables, a Python scripting facility, an easily used “common commands” button, and an export button which allows the output to be exported directly to Word, Excel, PDF, html, plain-text, or (just for graphics) various graphics formats like JPG and GIF.
An “identify duplicate cases” feature will be quite a boon to survey users; it’s a fairly flexible tool, too. The menus and toolbars can finally be customized, which can help speed up the daily routine.
A “visual binning” tool makes it easier to sort out the variables into categories (scale, ordinal, etc.), and another tool allows for date identification, another very useful new feature; the multiple response categories tool was already available and handy for surveyors. People can change the user interface from “Macintosh” to “SPSS standard” so they can experience the joys of seeing three different menus, one on each window, and each one containing different commands (this is mainly useful for platform-switchers and those using two computers on a regular basis.)
Every analysis gets a little header that we delete, telling the valid and missing sample sizes in summary form, even if they're in the regular output. We thought this could not be shut off, but the people from SPSS corrected us — you can shut it off, using the Output Management System (look for OMS). The output management options are extensive and allowed us to shut off repetition of commands, warnings, and other items — it’s a real improvement, except that in PASW 18 (vs 17) it got more complex, allowing more fine-grained control but also making it harder to set global preferences.
Copying and pasting is easy when it works; copied tables are pasted as ordinary text in programs like Dreamweaver, as tables in Word, and as data in appropriate cells in Excel. If you want to retain the formatting, paste into Word; if you want to manipulate the results, Excel. You can also save the output window and get at it that way.
PASW 18 is a real improvement, allowing us to copy larger tables, and to copy multiple output tables at once.
Charting is far better than in the past; though creating charts is a fairly clunky process in some ways, charts come out with sensible, clear formatting, are incredibly editable, and provide numerous options for scientists, statisticians, quality folk, and ordinary people. What’s more, the system pumps out the syntax whether you asked for it or not, so you can make minor changes manually without going through it. A test with fake data is:
Pivoting trays make it easy to change the way tables are printed; rows can become columns, for example, and layers can be made into rows or columns very easily. Anything can be switched to another place. Only a few commands (including REPORTS and LIST CASES) still produce old-fashioned, space-formatted, typewriter-font output. Since the REPORTS command is useful, we hope they get around to converting all the commands to clean, tab-delimited output.
Charts, like tables, can be customized, and various formatting options can be saved as a chart style. The ability to save chart formats and to specify some options in syntax helps.
SPSS 18, like prior versions, also reads tab-delimited and fixed-format ASCII text and Excel files. Output files can be saved as html for posting on the Web. SPSS also sells programs which allow other people to view the results and delve deeper into the data. Dividing and subdividing data sets is fairly easy with commands such as Split File and extensive reporting features. Split File lets you sort results by a variable (or several variables) - for example, running any test or description separately on each location in a survey, using a single command. This can be a real time-saver.
One advantage of PASW is its ubiquity: software packages support exporting directly to .sav files, help is everywhere, and many people know how to use it. On the other hand, the same thing could be said, to a somewhat lesser degree, about SAS; and Stata has an active user community in the sciences.
The optional and very handy Reports module produces output with tab-delimited tables (case and row summaries; other Reports are camera-ready), and can save time when, for example, analyzing survey data. Most people will probably export (usually via copy and paste) PASW tables and charts to other programs for publication.
This is not a bug per se, but after all these years, one would think that SPSS would make it easy to call up the dictionary and output windows by using keyboard commands, at least when there is just one of each. There is a keyboard shortcut for data, but not for the other windows.
We also wish that PASW - SPSS would finally re-implement the use of Macintosh-specific open/save dialogue boxes, since the bare Java interface is painful at best.
We were surprised by an email saying that you could no longer save to Stata format, so we tried it, and crashed the SPSS engine. That required restarting PASW. We tried it twice, once saving to Stata 8, once to Stata 7; once specifying the .dta extension, once ignoring it. Both times, PASW crashed, and created blank .dta files. We tried making a test file with just five variables and five cases and no label names or other frills, and that crashed, too.
PASW also won't save to SAS without crashing, period. Our request for tech support on this was denied but as far as we know the solution is waiting for 18.02.
You can now change the size of dialogue boxes, so that if you want to see longer variable names in, say, Recode, you can - but you can't change the size of any particular element, resulting in some serious stretching at times. Indeed, our 22 inch monitor wasn't wide enough to get to the end of some variable names.
Michael Karcher noted that SPSS 18 cannot read old .spo (output) files from either platform; we were able to verify this (the Windows version also cannot read spo files, but Windows users get a free reader for older versions; Mac users do not). SPSS 18 does read old data files from as far back as SPSS 10, and probably earlier, without issues, and old syntax files are no problem. What’s more, SPSS 10 can read PASW 18 data and syntax files. But output files are not interchangeable.
When you have a syntax window open, you can choose which dataset it refers to - by number, but not by title. Unless you can remember which dataset you opened first, or always have the same datasets open, that’s rather awkward in practice.
The new syntax window has clever autocomplete and explanation functions (putting error test below the syntax itself), which are handy. However, when it does warn you of a syntax error, it does so in an unwrappable text block similar to the output blocks; so if you have a skinny syntax window (writing PASW syntax has short lines), so that you can show the output and data editor as well, you can’t read the warnings anyway. On the lighter side, you can now choose whether the output moves to the front of the window or stays where it is when you run a command, which helps PASW’s interactivity.
PASW is pricey when compared with JMP and Stata, and on top of the steep cost for the base package, many users will need extra modules, each of which costs about as much as a low-end version of Stata. Academic prices are substantially discounted even for single users; there are also dramatically discounted “graduate packs” and "starter packs" good for four years; and site licenses.
Given the breadth of PASW, it is nearly impossible to go into any depth on its statistical features. However, in every test we performed on release 18, its numbers matched the output of the highly regarded Stata, perfectly, which is more than we could say for SPSS 16. (JMP, StatPlus, and the free MegaStat also matched Stata).
The price of PASW may be worth the ease of use for most people — time is money, and spending days figuring out how to get basic features to operate quickly stops paying off. That said, the interface is sluggish, certain operations are unnecessarily difficult (especially dealing with the output window), and there are numerous gaps in the ease-of-use. You can easily find free software that outraces PASW without breaking a sweat.
In the end, it comes down to how intense a statistician you are. If you spend your full work day crunching numbers, can master syntax, and are really into statistics, PASW will annoy you; it may be time to move over to Stata. If you do a lot of copying from the package to Excel, and do exploratory or graphical work rather than the same thing over and over and over and over again with minor changes, then JMP may be for you. On the other hand, if statistical research is a relatively small part of your life, or if you really need the usability of the graphical user interface, or if you're doing so many different things to a dataset that you can't remember all the commands, PASW will be very handy. That’s especially true now, with its many usability improvements. (Real beginners would do better with the free Sofa Statistics.)
Copyright © 2005-2026 Zatz LLC. All rights reserved. Created in 1996 by Dr. Joel West; maintained since 2005 by Dr. David Zatz. Contact us. Terms/Privacy. Books by the MacStats maintainer