
Mac Statistics Wizard 2: fast and surprising quick-summary software
This review is still in draft mode and may be inaccurate.
Wizard showed up fully formed in June 2012. The fast, multi-threaded program had a deceptively simple interface which belied some advanced analyses. Developer Evan Miller used native Mac technologies for everything (e.g. Quartz for graphics), making the program fast quick and light (no 300-MB downloads!)—and capable of handling up to about 2 million rows.
Over seven years of continuous improvement later, on January 6, 2021, came Wizard 2, with the same design philosophy but some nifty new and surprising features. For example, let’s say you need to capture data not from SPSS, but from HTML (web pages). That tends to be hard; in the past, I’ve tried copying and pasting with a combination of Excel, BBEdit, and an old version of GoLive, and still had issues. With Wizard, you open the web file and...
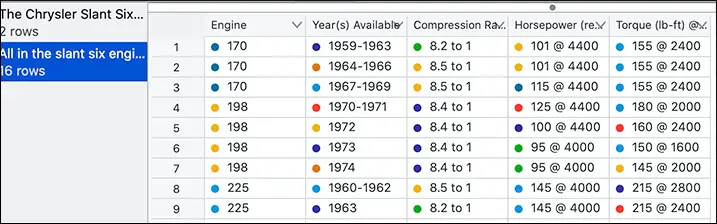
There it is! No fuss, no muss. It was a table; now it's a tableset, a spreadsheet, ready for analysis (well, not really, in this example) or export to SPSS, Excel, R, JSON, CSV, Stata, or SQL. Some people may find the price worthwhile for that one feature.
Here’s another welcome and surprising feature: adding data previews to the Mac Finder. Just select an SPSS (or other) data file, and Wizard’s QuickLook addition will show the actual data from the file in the preview area. This happens without any extra installation or manual intervention; install Wizard, and you get data-file previews in the Finder, just like you’d see a bit of text from a Word file or a small image from an image file.
Other key improvements include larger graphics in the interface, a new Correlate module, new importers, and full optimization for Apple’s new M1 chip. The one downside is that the software has gone from a one-time-only price to subscriptions—$20/quarter or $50/year, with Wizard 2 Pro at $130/year. Upgrade pricing is in effect, in the form of a first-year discount (from $15 off for the first year for those upgrading from Wizard, and $70 off the first year for those upgrading from Wizard Pro). Even did promise that the original Wizard and Wizard Pro will continue to be supported, and will work on Big Sur and the new M1-based computers. Documents for the two versions will be interchangeable. That means users can decide whether to upgrade and join the subscription treadmill, or stay where they are now.
What’s the difference between standard and Pro? Some of the best features for some of us: support for SAS, SPSS, and Stata files and commands, and for SQL connectors.
Wizard is ideal for discovery and revelation, and while you can screen-capture (but not export) its capable graphics, you cannot program it to do things repeatedly. That’s not the point, though. You can do numerous analyses quickly, without searching for syntax. Wizard provides both rapid visualization and key statistics, which appear without asking or any noticeable delay.
For those who do surveys and such, having means, medians, and other descriptives appear in the list of variables is a time-saver. So is support for long variable names (which show up as variable descriptions, off to the top-right); if you want to create a bunch of long variable names, or add value labels, you can use SPSS or SAS dictionaries. SPSS dictionaries, at least, can be done by anyone using a text editor and the .sps extension.
The default raw data view, in spreadsheet mode, allows instant sorts and—now—quick editing as well; to make sure you don’t change data by mistake, you first have to click a button (bottom right of the screen) to edit data. The color disappears when you do this, so you won’t be confused about what mode you’re in.
You can bring in data from text/spreadsheet formats (CSV, tab-delimited, Excel), SPSS (regular and portable files), JSON, R, SAS, and Stata, and you can export to CSV, JSON, Stata, SPSS, or R, which makes it double as data-file translation software (that alone, I might add, used to command a stunningly high price in the software market).
Wizard’s user interface for summarizing data is called Pivot; it saves the summaries as tables, which may ring bells for anyone who has used Minitab. Pivot functions include count, sum, mean, standard deviation, variance, min/max, and percentiles; tables appear or change instantly, and are easy to modify, far easier than with Excel’s clunky interface.
Data can be recoded fairly easily; you can create indicator variables (binaries based on selected values of normal variables), or do recodes which affect both the output values and the output value labels. The program has built in, separate recode controls for creating logs of variables and standardized versions of variables.
A plethora of keyboard commands, often neglected in Mac programs, keep things fast for the experienced, um, Wizard. Once you know the keyboard equivalents of the commands you use most often, you can speed through datasets at the speed of your own comprehension. Wizard also has well populated right-click (control-click) menus, bringing key options to your mouse pointer.
Wizard makes surprisingly accurate guesses, which you can override, as to the nature of variables; it also lets users specify missing values, always a handy feature. Users have to be a little adventurous (or read the manual carefully); for example, you get filters by dragging the top boundary (while you can only choose one value to filter by per variable , it iseasy to create indicator variables, e.g. “everyone aged 32-58”). Drag the right hand boundary, and medians, minimums, and maximums show up. Right-clicking provides full menus which include log-recoding and standardizing for variables (they instantly create newly recoded variables).
Importing data preserves value and variable names and missing value designations; right-clicking on a picture lets users export it. When images are exported as PDF, they are vector images, so they can be resized at will without losing any detail.
You can test numeric columns for uniformity with a Kolmogorov-Smirnov test (and accompanying Q-Q plot). Category variables have an extra viewing option for seeing the confidence intervals in bar chart form (choose "Bounds"). This should be useful for polling-style data where you want to see if one proportion is significantly greater than another.
Log-likelihood of multinomial models can be broken down by category, so you can see whether changes to the model affect the model fit for all categories, or only some of them. Sensibly, the normality test starts with Shapiro-Wilk, then, with N>5,000, automatically switches over to Kolmogorov-Smirnov
One of these updates was adding a "Treat as Categories" button (for selected variables), which is helpful especially given that the program automatically chooses analyses based on the type of variable.
If you build a model with a category variable as the outcome you can choose between multinomial logit and ordered probit as the underlying model; due to support for fixed effects, you can control for large category variables (e.g. state or county) quickly. There is now support for higher-order terms in regressions (quadratic, cubic, etc) — with a numeric column selected, choose Model > Explanatory Variable > Higher Order Terms. These are in the Predict interface, so now you don't have to separately move around multiple sliders to see the total effect of changing a variable that enters into the regression as a polynomial.
Evan Miller, the developer, provided numerous updates since Wizard 1 was released, so we can expect Wizard 2 to improve over time and be maintained properly. Support is handled via Google Group forum and directly from the developer.
Get Wizard 2 on the App store.
Sponsored by Toolpack Consulting

Copyright © 2005-2024 Zatz LLC. All rights reserved. Created in 1996 by Dr. Joel West; maintained since 2005 by Dr. David Zatz. Contact us. Terms/Privacy. Books by the MacStats maintainer