
Some of these packages have an astonishing array of statistical tools; they vary rather dramatically in ease of use, cost, and graphics. Updated November 2024 and integrated with the old “other software” page.
Sold through Apple Store: $20/quarter (Pro, $130/year); upgrade discounts
Listing updated: January 2021
Wizard 2 and Wizard 2 Pro — not to be confused with Wizard and Wizard Pro — are surprising packages from Evan Miller (creator of Magic Maps) meant for quick analysis and visualization, without a tortured interface. Wizard imports data with stunning speed, and comes up with summaries (including appropriate graphs). The new versions are incremental improvements over the original, with some surprising and well-implemented new features. Wizard Pro 2 Review.
One of those clever new features is being able to capture properly formatted data from sources as varied as SPSS and HTML — you can feed in a web page and get a table back. This is hard to do, and most software cannot do it, even web software. Wizard 2 also adds a QuickLook feature for SPSS data files, so you can preview databases from the Finder.
Other key improvements include larger graphics in the interface, a new Correlate module, new importers, and full optimization for Apple’s new M1 chip. The one downside is that the software has gone from a one-time-only price to subscriptions—$20/quarter or $50/year, with Wizard 2 Pro at $130/year. Upgrade pricing is in effect, in the form of a first-year discount (from $15 off for the first year for those upgrading from Wizard, and $70 off the first year for those upgrading from Wizard Pro). Even did promise that the original Wizard and Wizard Pro will continue to be supported, and will work on Big Sur and the new M1-based computers. Documents for the two versions will be interchangeable. That means users can decide whether to upgrade and join the subscription treadmill, or stay where they are now.
Sold through Apple Store: $80 (Wizard) and $200 (Wizard Pro)
Listing updated: January 2021 (software still under development despite Wizard 2 release)
Wizard and Wizard Pro — not to be confused with Wizard 2 and Wizard 2 Pro — are surprising packages from Evan Miller (creator of Magic Maps) which is meant for quick analysis and visualization, without a tortured interface. Wizard imports data with stunning speed, and comes up with summaries (including appropriate graphs) instantly. We tested it with large databases, including the General Social Survey, and results were practically instantaneous. Wizard Pro supports Stata dictionary (.dct) and some SPSS command files (.sps), surprising features indeed! It also imports from Numbers, SAS, Excel, and even Microsoft Access — something that’s otherwise hard to do on a Mac.
Wizard is set up to instantly provide summary statistics and charts on large numbers of variables, and also does instant correlations and multiple regressions. It's a discoverable program that delivers a level of “pleasant uniqueness” we haven’t seen in a long time.
There is a Pivot interface for producing numeric summaries and saving them as their own tables, á la Minitab. Pivot functions include count, sum, mean, standard deviation, variance, min/max, and percentiles; tables appear or change instantly, and are far easier to modify than, say, in Excel. There is support for frequency weights, optional display of odds ratios, and various other improvements.
Wizard has full date support, Excel exports, numerous tests (Mann-Whitney and Kruskal-Wallis, 2-sample and N-sample Kolmogorov-Smirnov, Negative Binomial, Cox Proportional Hazards), double-precision storage for numeric data, and custom delimiters in imported text files. Following versions continue to increase the scope and quality of the program, on a regular and rapid basis. (Wizard Pro site) Wizard Pro Preview.
Price: $10
Acastat handles up to 100,000 cases and 100 variables, depending on system memory. It does frequencies (with chi-square goodness of fit), lists, descriptives (by subgroups), diagnostic accuracy measures, crosstabs with various related statistics, t-tests, one-way ANOVA, correlations, simple and multiple regression, logistic regression, and appraisal analysis. There’s a real estate module for tax assessments, and a setup to try to generate charts from inferred data in summary statistics.
The software appears to be easy to figure out and learn, providing most of the statistics that most people use day to day, and some that one has to pay extra for from SPSS. We did not test Acastat's accuracy but overall it appears to be a very promising entry. (Mac App Store version)
Listing updated: 2/22/2022
Price: $6 (via Mac App Store); iPad version, $2
StatCalc is designed to do the most common, basic tests: comparing means and proportions, showing frequencies and descriptives, doing weighted means, chi-squares, goodness of fit, and such. The Decision Tools module explores price elasticity of demand, queuing theory, constant dollars, and decision tables.
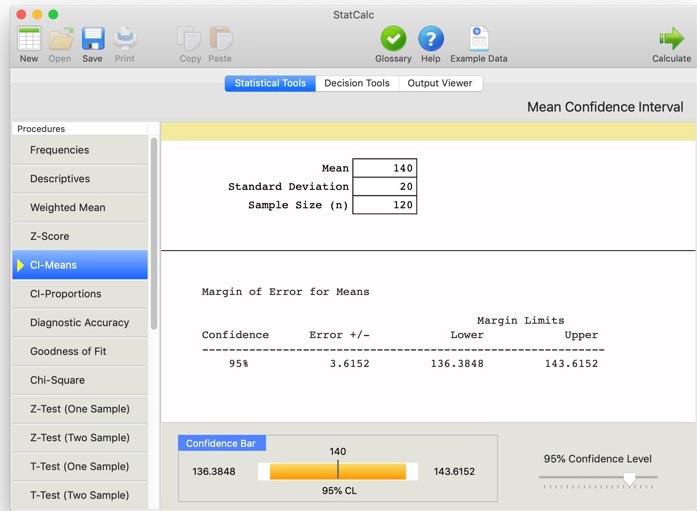
It is very easy to use, fast, and cheap — and continuously maintained. There is an iPad version, too.
Price: via subscription only, $276/year; $174/year academic; $114/yr student; or $40/month
Listing updated: 10/2020; last code update, 10/2020
GraphPad Software [(800) 388-4723, +1-858-457-3909] sells Prism, a multi-platform package that emphasizes biostatistics for laboratory work. GraphPad’s CEO and founder, Harvey Motulsky, wrote: “We release new versions of GraphPad Prism every 3-4 years, and Mac and Windows development are done nearly simultaneously.”
GraphPad’s Prism is a strong platform for exploratory statistics and graphing, providing the usability of graphing software with many advanced statistical capabilities. Numerous graph types are available along with flexible regression curving. For more details, read our GraphPad Prism review.
Pricing: $195 commercial, $89 student, $119 academic; bulk rates exist
Listing updated: August 2019; software was just updated then
StatPlus is a fast-loading program that has a small number of menus — one that launches Excel or Apple Numbers; one that provides statistical analyses; and one that manipulates data. The analyses menu provides simple, easily understood categories, and underneath those are submenus with the actual operations. It’s easy to learn, yet contains numerous statistical methods that are not normally provided by easy-to-learn software, including one, two, and three way ANOVAs, GLM models, and many other analyses. The Help system is fully developed, in a standard Mac format, and is moderately easy to read. Cleverly, StatPlus launches Excel or Numbers automatically when you start it up, saving a step and making it seem more seamless.
Requires Excel; works on Intel, PPC, Windows
Listing updated November 2024; software seemed current
MegaStat is maintained by J. B. Orris, Butler University, and distributed by McGraw-Hill. It does its own calculations. MegaStat can deal with stepwise regressions, large factorials, time series/forecasting, descriptives, frequencies, nonparametrics, QPC sharts, and numerous hypothesis tests.
In short, MegaStat packs all the power most people will ever need into a relatively inexpensive, easy to use package. The down side is that it’s moderately slow, has no scripting language, and requires Excel; and you may need to buy a textbook to get it. In 2017, we tested MegaStat’s output to find that it was identical, to six decimal points, with that of Stata.
Pricing: Numerous versions and options.
Listing updated: November 2024
XLSTAT, sold by Pearson, runs inside Excel but does its own calculations. Information about it is unclear at this time.
Pricing: Versions start at $160 per year with an educational discount.
Listing updated November 2024; software is up to date.
Stata has frequent updates between releases, and simultaneous releases across platforms. Their price is much lower than SPSS, and there are no “gotcha” costs for extra modules. Stata's Mac support has been excellent for many years. (See our Stata 11 statistical software review.)
Stata has a macro language, a syntax language, a matrix language, a massive collection of user-contributed modules, Python integration, a spreadsheet for data manipulation, an advanced variable editor, copy and paste to word processors (without formatting), and extreme depth and breadth in statistical functions. Stata graphing is advanced and more “print-ready” than SPSS.
Stata generates web pages with mixed text, graphs, and such, and supports Markdown and dynamic documents; it can generate Word, Excel, or PDF files, and has built in versioning.
Listing updated: 10/2018
Gauss is a widely used, “big-time” package...but let’s let Aptech Systems, the developers, say it:
The GAUSS Mathematical and Statistical System is a fast matrix programming language widely used by scientists, engineers, statisticians, biometricians, econometricians, and financial analysts. Designed for computationally intensive tasks, the GAUSS system is ideally suited for the researcher who does not have the time required to develop programs in C or FORTRAN but finds that most statistical or mathematical "packages" are not flexible or powerful enough to perform complicated analysis or to work on large problems.
Joel West, the creator of this site, wrote: “Gauss was never available on Macs before, and is considered the high-end statistics package for economic research. Here's a good third party resource for Gauss.”
The last time we checked the web site, we were unable to discover pricing.
Requires Mathematica 9, Intel Mac; previous versions PPC compatible
Listing updated: 1-2017
mathStatica is an add-on package for Mathematica which provides algebraic and symbolic solution to statistical problems. Thus, it is supported in the same configurations as Mathematica for the Macintosh. It is published by MathStatica Pty. Ltd. It now provides an arbitrary-precision numeric engine for accuracy, especially in highly iterative processes.
The software is sold as mathStatica Basic (bundled with the associated book, Mathematical Statistics with Mathematica) and as mathStatica Gold ($69 upgrade from mathStatica Basic).
Pricing: by subscription ($99/per month and up), add-on modules are $79 each
Grad and Student Packs start at around $70 for one year.
Listing updated: November 2024
See our starting guide to using SPSS statistical software and our review
SPSS was the industry standard statistics package when it was purchased by IBM; the price was jacked up, and then switched to a subscription model. Many features require pricey add-ons. The user interface is Java-based and very slow, especially when opening windows.
SPSS Mac easily exchanges data, syntax, and output files with the Windows version, and with most older versions (even those which can’t deal with long variable names). Output file formats changed a few years ago, but can be read in the free PSPP if needed. (Sorry, newer SPSS output file formats have made this untrue!)
There is no shortage of fine statistics software at prices far below those of SPSS. Based on our use of Release 27 for Windows, the changes have been incremental, not revolutionary, since version 11. The software looks prettier but is slower. There have been some welcome changes (better output formatting, more sensible option setting) and some that are less than welcome (slower interface).
SPSS 10.08a can run in Classic mode under OS X on PowerPC machines if you (1) right-click (or control-click) on the SPSS 10 program package (not the alias) and select "Show Package Contents;" (2) drag out the SPSS 10 for Macintosh alias from the package; (3) close the folder and use the alias you just dragged out of the SPSS package to start the program.
Free alternatives that use SPSS data files: JASP, Jamovi, PSPP (SPSS clone).
Price: $1,325/year (academic discounts available)
Listing updated November 2024; software was current at the time.
With Design-Expert software, “you can not only screen for vital factors, but also locate ideal process settings for top performance and discover optimal product formulations. Easily view response surfaces from all angles with rotatable 3D plots. Set flags and explore contours on interactive 2D graphs; and use the numerical optimization function to find maximum desirability for dozens of responses simultaneously. Handy for DOE!
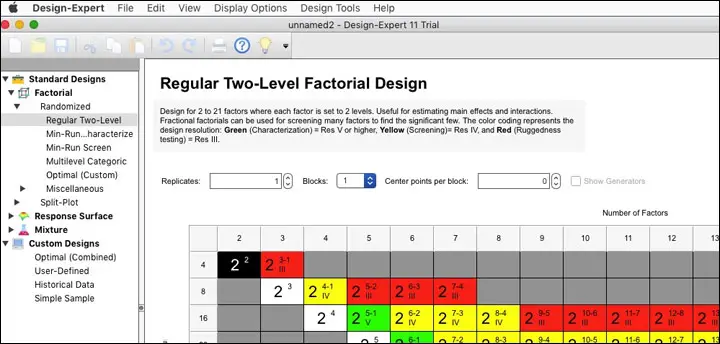
This is not software for those who only vaguely remember some high school or college statistics; it’s for a relatively sophisticated audience. That said, it can make some difficult decisions easier, as the blurb above promises. You can adjust many aspects of the software through the preferences, including just about type of type size, other than the little explanations in the boxes (e.g., in the illustration above, where it says “Design for 2 to 21 factors...”) which is quite small.
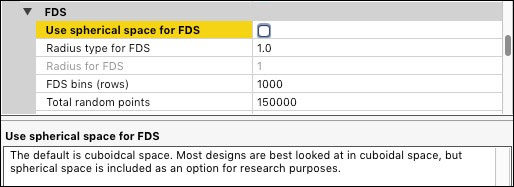
Once installed, Design-Expert reloads quickly, bringing the user to a choice of using a wizard, which is fairly thorough in its descriptions; creating a new design in a more traditional way; or opening a saved design (using the native Mac dialogue box). The program uses the Mac menus and feels native in every way, including responsiveness; preferences are in the right place.
Current version: 1.1
Price: 99¢ from the Mac App Store
Software last updated August 2018, listing created August 28, 2018 and updated October 17, 2018.
Mark Brown’s 99¢ app on the Mac App Store is designed for one and only one purpose: conducting a chi-square test of independence from a contingency table of any size. You can hover over cells to see the expected value, too. Mark said he’d work on importing from Excel and such for a future version; in the meantime, it’s hard to argue with an easy-to-use program that does one thing (well, two, including viewing expected values) but does it very well. (We have tested it and it looks just about the same on our screen; the typeface is a little more readable now.)
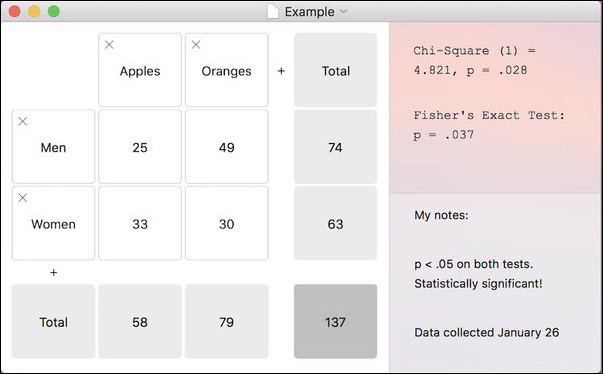
Not seen in the screen shot: when you hover over a cell, it shows the expected value. You can easily add columns or rows by clicking in the plus signs, so it's not just for 2x2s. You can change the number of decimal places for the Chi square or p, and use a Yates correction factor. Data entry is easy — click in the first cell, type in a value, then just press tab to get to the next cell and the next, until you're done (you don't have to click on each cell). This is, in short, a fast, easy, one-trick pony that does what it says it will, and won't break your budget (or at least it won't break your budget by more than 99¢).
This graphing program computes ANOVAs, including repeated measures ANOVAs. See its listing on the Graphing page. An add-on for Mathematica is available.
Configurations Available: Mac, Linux, Windows
Price: Free (and open source)
Current Version: 7.8.5 / 8.0 Preview
Listing updated 10-3-2021
Last software update, 12-21-2020
Michael Barton pointed out that GRASS is used for geographic resources data management, image processing, graphics production, spatial modelling, and visualization of many types of data. It is an official project of the Open Source Geospatial Foundation.
Originally developed by the Army as a tool for land management and environmental planning, GRASS is a powerful utility with a wide range of applications in many different areas of scientific research. GRASS is currently used in academic, government, and commercial settings. Attributes are managed in a SQL-based DBMS.
GRASS 6 added a new topological 2D/3D vector engine and support for vector network analysis. A new display manager has been implemented. The NVIZ visualization tool was enhanced to display 3D vector data and voxel volumes. Messages are partially translated with support for FreeType fonts, including multibyte Asian characters. New LOCATIONs can be auto-generated by EPSG code number. GRASS is integrated with GDAL/OGR libraries to support an extensive range of raster and vector formats, including OGC-conformal Simple Features.
Configurations Available: Mac, Linux, Windows
Current version: 3.20
Price: Free (and open source)
Signed for newer Mac versions
Listing updated 10-3-2021; last release, 9-10-2021
Quantum GIS is a somewhat less powerful but easy to use GIS package for Mac, Linux, and Windows. It is also an Open Source Geospatial Foundation project, and it supports numerous vector, raster, and database formats and functions.
Configurations Available: Mac (under X11), Linux, UNIX, OS/2, Windows [requires Cygwin or VirtualBox for full function]
Current Version: 6.2.1 (released June 2021)
Price: Free (and open source)
Listing updated 10-3-2021
Generic Mapping Tools, or GMT, is an open source collection of many tools for manipulating geographic and Cartesian data sets (including filtering, trend fitting, gridding, projecting, etc.) and producing Encapsulated PostScript File (EPS) illustrations ranging from simple x-y plots via contour maps to artificially illuminated surfaces and 3-D perspective views. A MATLAB extension is available.
gretl does time series and other statistics; see “other software,” below.
Price: free-$25
Listing last updated: 1-2-2017
Available in the Mac App Store
Makes pretty timelines.
Version 3.9; Automator, Spotlight support;
Price:
$100, available in the Mac App Store, Lite version $10; volume discounts
Listing updated 2-18-2020; software updated 2020
Published by Spectraworks, kSpectra Toolkit is “a set of programs for advanced spectral analysis of univariate or multivariate time series arising in many of the physical sciences, ranging from electrical engineering and physics to geophysics and oceanography, as well as biomedical sciences. The toolkit contains procedures for estimating the spectrum of a time series, decomposing the time series into trends, oscillatory components, and noise, and reconstructing the contributions of selected components of the time series,” according to the web site.
Dennis Kahlbaum wrote: “makes time series analysis relatively easy via GUI and built-in functions/methods.”
Price: free-$25
Listing last updated: 1-2-2017
Makes pretty timelines. Available in the Mac App Store.
Price:
$100, available in the Mac App Store, Lite version $10; volume discounts
Listing updated 2-18-2020; software updated 2020
Published by Spectraworks, kSpectra Toolkit is “a set of programs for advanced spectral analysis of univariate or multivariate time series arising in many of the physical sciences, ranging from electrical engineering and physics to geophysics and oceanography, as well as biomedical sciences. The toolkit contains procedures for estimating the spectrum of a time series, decomposing the time series into trends, oscillatory components, and noise, and reconstructing the contributions of selected components of the time series,” according to the web site.
Dennis Kahlbaum wrote: “makes time series analysis relatively easy via GUI and built-in functions/methods.”
Statistical analysis (particularly time series analysis) can also be done using general-purpose mathematical software (especially with optional or standard plugins) such as:
Configurations available: MacOS X, Windows
Price: free
Listing updated 10-3-2021
Multimedia product designed to teach college-level statistics (with emphasis on DataDesk).
The site point sout that ActivStats Tools are based on the ActivStats statistics e-book, which includes t-tests, chi squares, and F tests; mean and regression boostraps; and randomization tests to do inferences. “These tools provide built-in datasets, but can also be used with any tab-delimited text data file for which the first row holds variable names.” Distributed by DataDesk.
Configurations OS X 10.9 or newer, “optimized for Big Sur”
Current Version: 6
Price: Free basic version; ranges from Advanced ($129) to Ultimate ($1,990) with $35 student version and educational pricing
Listing updated 10-3-2021; software last updated Feburary 2021 to fix Big Sur bugs. Last major update, 2019.
Knowledge Miner’s data mining tool can now stand on its own, without requiring Excel. It can build predictive and descriptive models — “explicit and complexity minimized mathematical models,” with the ability to self-select inputs and show their importance. It has three languages — English, Spanish, and German.
Since Insights is now standalone, it’s able to run as full 64-bit software with parallel processing, boosting speed dramatically. Excel support is optional, for importing directly from Excel 2011 or 2016. Models can be exported in various formats.
The $129 Advanced version forecasts complex time processes without models, automatically runs simulations or forecasts real-time data (storing up to 5 steps ahead — the Ultimate version goes up to 120), exports models in generic form, can run up to 100 inputs with 50,000 samples, and supports up to 100 forecasting steps.
The Professional edition also does cost-sensitive modeling (including ROC and cost curve plots), also exports models in Objective-C and AppleScript, can run up to 2,000 inputs, with one million samples, and has unlimited forecasting steps. Ultimate adds self-organization modeling of interdependent, complex systems, can export systems of equation in Excel, and can handle 25,000 potential inputs.
The company’s own description:
INSIGHTS is original 64-bit parallel software for building predictive models from data, automatically, by evolutionary, self-organizing modelling approaches. Taking observational data that describes a problem, system, or process, the software constructs a working mathematical model... its AI-powered, self-organizing, modeling algorithms allow users to easily extract new and useful knowledge to support decision-making. ... Users in nearly any field can employ the easy-to-use software to analyze noisy data sets and build powerful models, which can be used to help to gain new insights into complex phenomena, predict future behavior, simulate "what-if" questions, and identify methods of controlling processes.
The software promises to hide the processes of model development, dimension reduction, variable selection, noise filtering, and model validation, self-organizing linear or nonlinear, static or dynamic regression models, to generate the equation that best describes the data. It also checks to see if the final model “reflects a valid relationship or if it just models noise.” It can create models for Status Quo or What-If problems, outputting models and model ensembles in ready-to-use Excel, Python, Matlab, AppleScript, or Objective-C code.
Version: 15
Price:
$499 (commercial),
$
179 (academic subscription; $349 perpetual),
$
99 (student one year subscription)
Listing last updated: 10-3-2021 (prices not checked)
Stat/Transfer can translate to and from most common statistical formats. It works surprisingly well, though you should check to make sure it can make the exact transitions you need. Version 15 brings support for Catalina and Stata 16.
This software is available from Marley Watkins at http://edpsychassociates.com/Watkins3.html (Thanks, Tricia Jones). It’s still kept up to date (when we last looked in 2024). Samples include:
(See free and open-source Mac statistics software.)
Didn’t find what you wanted? Try graphing / visualization (sometimes with statistics built in) and The Dead Zone
Copyright © 2005-2026 Zatz LLC. All rights reserved. Created in 1996 by Dr. Joel West; maintained since 2005 by Dr. David Zatz. Contact us. Terms/Privacy. Books by the MacStats maintainer